Optimization of the Integration Design of Acoustic Surveying Instruments on USVs
Summery
Due to the relatively size and shallower draft, USVs carrying survey instruments are sensitive to surrounding environment and are easily affected by strong shakiness and massive bubble turbulence. To overcome these disadvantages, this essay presents an optimized design scheme for the installation of acoustic instruments on USVs. We study how different hull designs, optimized designs, propulsion system optimization, and instrument deployment would affect on the survey result of a USV by conducting hydrodynamic simulation and field testing aiming at finding out the best design to ensure the high quality of survey data collected by USV.
Background: Noises and Bubbles, Destructive Influences to Acoustic Instruments
Nowadays, instruments applied in oceanology survey are primarily acoustic. As a working platform on sea surface, survey boats have an unneglectable effect on acoustic instruments. Instruments with higher precision are more sensitive to noises and bubbles which can easily affect the quality of data and survey results.
A survey boat can affect surveying acoustic instrument from three aspects including hull noise, bubble layer, and solid-liquid coupling, all of which can cause shaking to acoustic instruments.
The hull noise, also referred as vessel radiation, falls into 3 categories including mechanical noise, propeller noise, and hydrodynamic instrument wet end noise.
On a conventional manned survey boat, acoustic instruments are usually either mounted on boat side temporarily or fixed to the bottom for long-term. A temporary installation uses a brief frame for easy and quick assembly, but the shaking and noise it causes are uncontrollable. A fix-to-bottom installation comes in 3 ways including hanging transducer unit to below the boat bottom or mounting transducer unit in a dome erects from the boat hull or embedding transducer unit into the boat bottom which would not change the hull shape at all.
Unmanned surface vessels are water surface robots that can carry out specific tasks and the functions and parameters of which are designed basing on mission target.
As a new generation of payload platform, USVs are more maneuverable, safe, and concealed compared to conventional manned survey boats. They excel in complex water surface environments, severe weather conditions, and sensitive political area operations when it comes to surveying sea bottom for oceanology purpose.
However, due to the size differences, there’s huge uncertainty and objectiveness if mounted instruments to USVs in the same way of to large manned survey boats. The USVs are usually of smaller size and limited payload space. The distance between the propulsion system and the wet-end of the surveying instrument is short while the shakiness and noise generated by the former would easily conduct to the latter and affects the survey result.
Due to the smaller size and shallower draft, USV and instrument deployed are sensitive to surrounding environment and are easily affected by strong shakiness and massive bubble turbulence. To overcome these disadvantages, this essay presents an optimized design scheme for the installation of acoustic instruments on USVs. We study how different hull designs, optimized designs, propulsion system optimization, and instrument deployment would affect the survey result of a USV by conducting hydrodynamic simulation and field testing aiming at finding out the best design to ensure the high quality of survey data collected by USV.
USV Platform Customized For Acoustic Survey Instruments
1. Hull selection
As shown in picture 1, there are two reasons why water movement on ea surface generates bubbles. On one hand, bubbles can be caused by the breaking waves generated by surface seawater movement. Waves would come into being around the bow area when a boat is sailing, during which the air would be clapped into surface water and form bubble layers. These widespread numerous bubble layers would absorb, reflect and even obstruct the propagation of sound waves. If a large amount of bubbles scour to the bottom of a transducer, the mlutibeam echosounder system would fail to work normally. On the other hand, bubbles would appear when the uneven surface of a boat hull is interacting with sea water. Any holes on the hull surface such as moon pool or valve box can cause bubbles too.
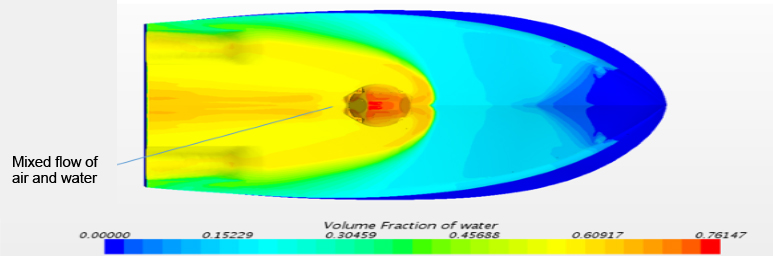
Pic 1 How the boundary layer interferes the acoustic equipment on the boat bottom
In the conventional surveying mode, it’s difficult to avoid the above conditions in essence when the survey is carried out on a monohull boat while interference can only be weakened by the following means.
①Plug transducer as deep as possible into sea water.
②Mount transducer in a dome to weaken the interference.
③Make sure the hull surface around transducer as smooth and horizontal as possible, seal all gaps and screw holes.
④According to a large number of numerical simulations and physical tests, when mounted on a wide and flat boat bottom, the lateral rise angle of which is less than 13°, a transducer would be easily affected by bubbles.
When a monohull boat requires all kinds of patches to weaken the bubble interference, a catamaran boat can solve the problem easily with its optimized hull design.
A catamaran boat consists of two sheets which are connected by a connecting bridge. A acoustic instrument is mounted on the intermediate vertical line between two sheets and the altitude of which is adjusted by a lifter. Such design allows the bottom of an instrument aligns to the boat bottom and not bump to the ground. Placing an instrument in the middle of a boat can effectively avoid the interference of waves and turbulence which mainly appear on the boundary layer of the boat hull.
Propellers and motors are mounted on the two sheets of a catamaran boat separately. Conduction of noise and shaking from propulsion system weakens since the wet end of acoustic instrument is not on the same axis with propellers.
Basing on the sailing theory of boats, a boat with a larger aspect ratio and square coefficient has better linear stability. A catamaran boat featuring with large aspect ratio and the square coefficient can achieve high accuracy in complying survey line. Theoretically, a catamaran boat is more preferable for oceanographic survey when it comes to boat hull selection.
2. Hull optimization
A catamaran boat is preferable for oceanographic survey theoretically, it doesn’t mean that all catamaran boats fit well in the case. A perfect hull design for a specific mission can only come into being after particular optimization and improvement according to the actual application requirement. Take OceanAlpha M40 Oceanography Survey USV for example, the optimized hull design of which is achieved by hydrodynamic simulations and prototype testings. Its design principles are as follows.
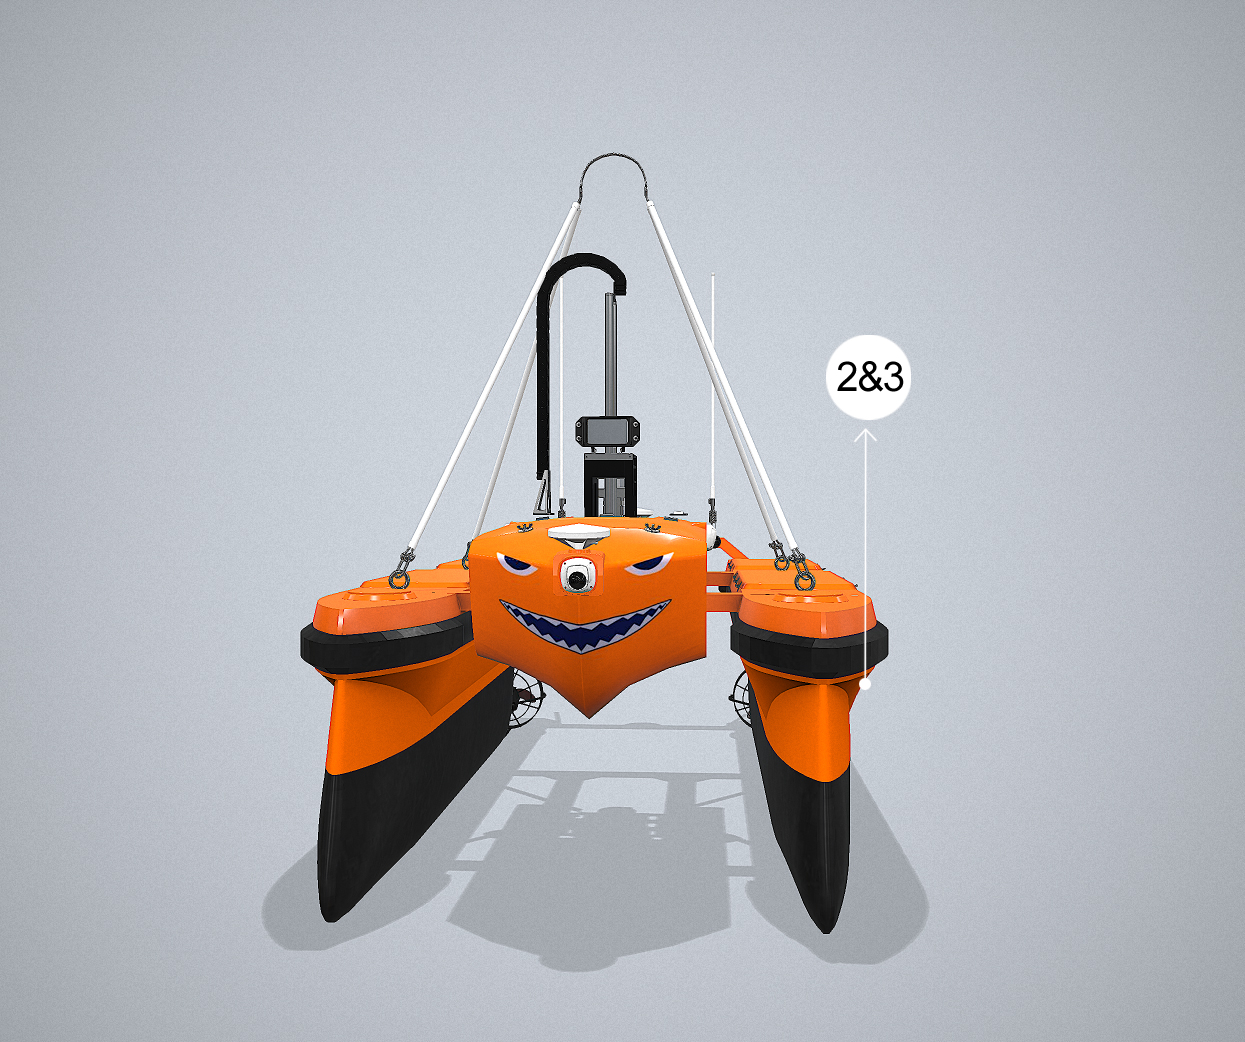
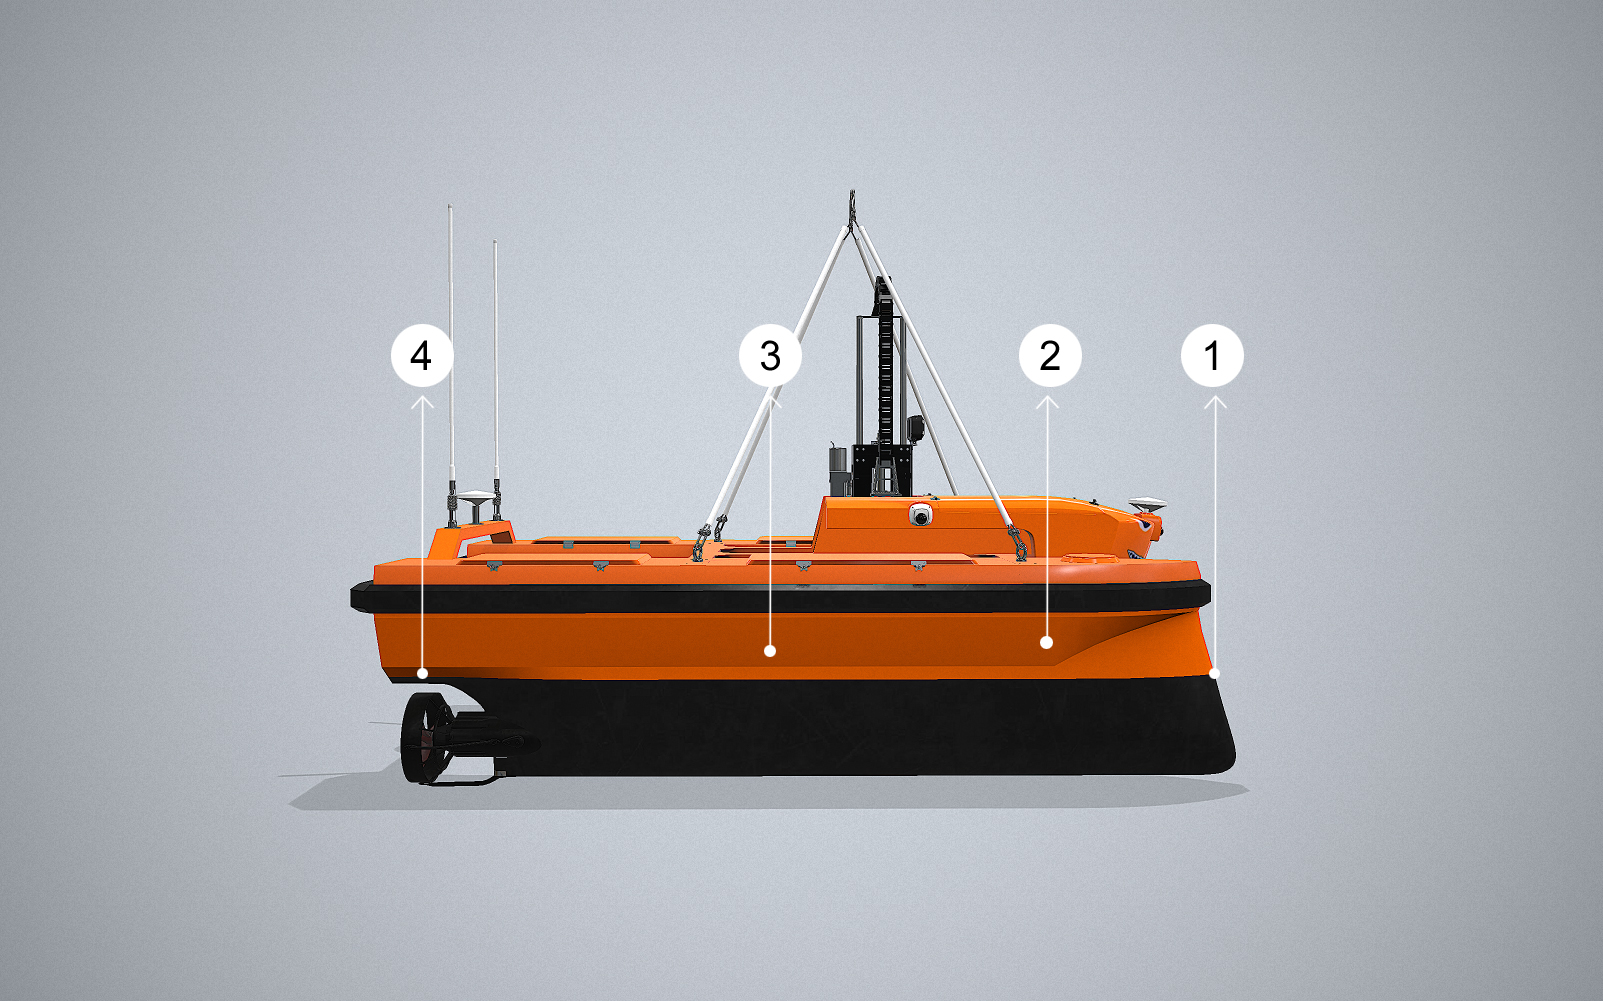
Pic 2&3 Hull optimization design highlights
①The wave-slitting bows of M40 USV can effectively avoid waves from breaking in bow area and can direct bubbles from below water to surface which if crowded on boat bottom would cause interference to survey instrument.
②A folding angle outreach design on the upper part of the bows can also avoid waves from breaking when the USV is sailing at 5-6 kn on still water. When sailing in high sea state, this design can reduce shaking, split flows and effectively avoid too many waves from scouring up to the desk.
③The boat bilge below water line is in a slim, long and round shape, which can reduce resistance when the USV is sailing at a low speed. Side hull above water line which slope outward can increase motion damping, reduce rolling, pitching, and heaving motion when the hull is rising up and down. Such design can also provide more cabin space and deck area for instrument installation and deployment.
④The stern sealing plates above water surface are extended backward and adopt a triangular section design. The extension can provide a large reserved buoyancy and reduce sloping and pitching amplitude during navigation.
The triangular section design can avoid the lower tail plates from slamming air into water above the propellers when the hull is pitching, reducing the probability of propellers getting out of water surface.
3. Power system selection optimization
USVs discussed in this essay are mainly for oceanography survey purpose. From pass surveying experiences it can be concluded that the noises of a boat hull are mainly generated by mechanical units and propellers. To ensure higher survey data quality, transducers of a MBES system should avoid these noise sources to the greatest extent.
Electric propeller is a better power system option for USV. Field test experiences show that the vibration and noise of a fuel engine are generally larger. In comparison, the vibration and noise of an electric propeller are much lower. When operating at a low speed, a high-quality electric propeller would cause minimal noise impact on surveying instrument. Moreover, the simple operating principle of an electric propeller makes it easier to achieve unmanned control, reduce the difficulty of design and maintenance, and free up more space for other equipment.
4. Propulsion system selection optimization
When optimizing the propulsion system design, one inevitable element is that the high-speed whirling of a propeller would generate bubble vibration that affects acoustic instruments. To avoid such a problem, it’s better to use propellers with lower speed and lower noise, and apply an anti-bubble optimization design to the paddles.
5. Acoustic surveying instrument deployment
To avoid interference from boundary layer, acoustic instruments, such as RESON T20, KONGSBERG M3, are usually mounted on the intermediate vertical line between the two sheets of USV.
Acoustic instrument is mounted on the bottom of a vertical lifter via an adapter flange. The lifter can control how deep an instrument plug into water.
During a surveying process, an instrument is lowered into water by 400mm so that the bottom of instrument aligns with the bottom of USV. In this way, the bottom of the equipment is protected from being damaged, and the influence of the wave and turbulence are also greatly weakened, thus optimizing the working performance of instrument.
When not surveying, the lifter raises the instrument to above water surface to reduce the resistance during navigation, increase sailing speed, and enhance maneuverability and endurance.
As shown in picture 4, the deployment of an instrument is determined by a hydrodynamic simulation. Basing on the navigation situations and hull wave conditions simulated under different speeds, the instrument is eventually deployed at the high level point of 6 kn, extending more than 400 mm into water.
The deployment has following advantages: the instrument is set at the high level point, which can weaken the interference of bubbles and turbulence from the boundary layer. The mounting position is close to the gravity center of USV, which ensures the movement consistency of the instrument and the boat hull to collect better data quality. The instrument can plug deeper into water in such a position to reduce the risk of getting out of water surface thus stop functioning under high sea conditions.
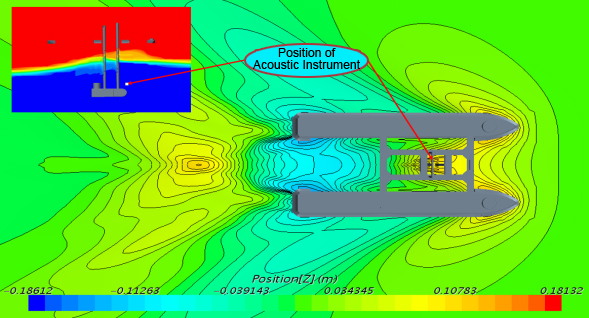
Pic 4 Simulation Diagram of The Acoustic instrument deployment
Field Test Proofing
As shown in Pic 5, in the field test, the USV is equipped with a T20 type multi-beam measurement system, a Wave Master inertial navigation system, and a wireless broadband omnidirectional communication antenna. Surveyor sent a survey task to the USV through a base station, and the USV uses above instruments to independently survey water depth and return data to the base station in real time.
The survey area is located on the west side of a river section.
There is a dredging vessel working in the survey area, large vessels such as sand transport vessels constantly sailing to and fro making the surveying condition relatively complicated. On December 7, 2017, the USV successfully surveyed a total area of 1000m * 600m under the condition of Sea State 2. The total surveying range is about 26 kilometers, of which the main survey line is about 25 kilometers and the contact line is about 1 km.
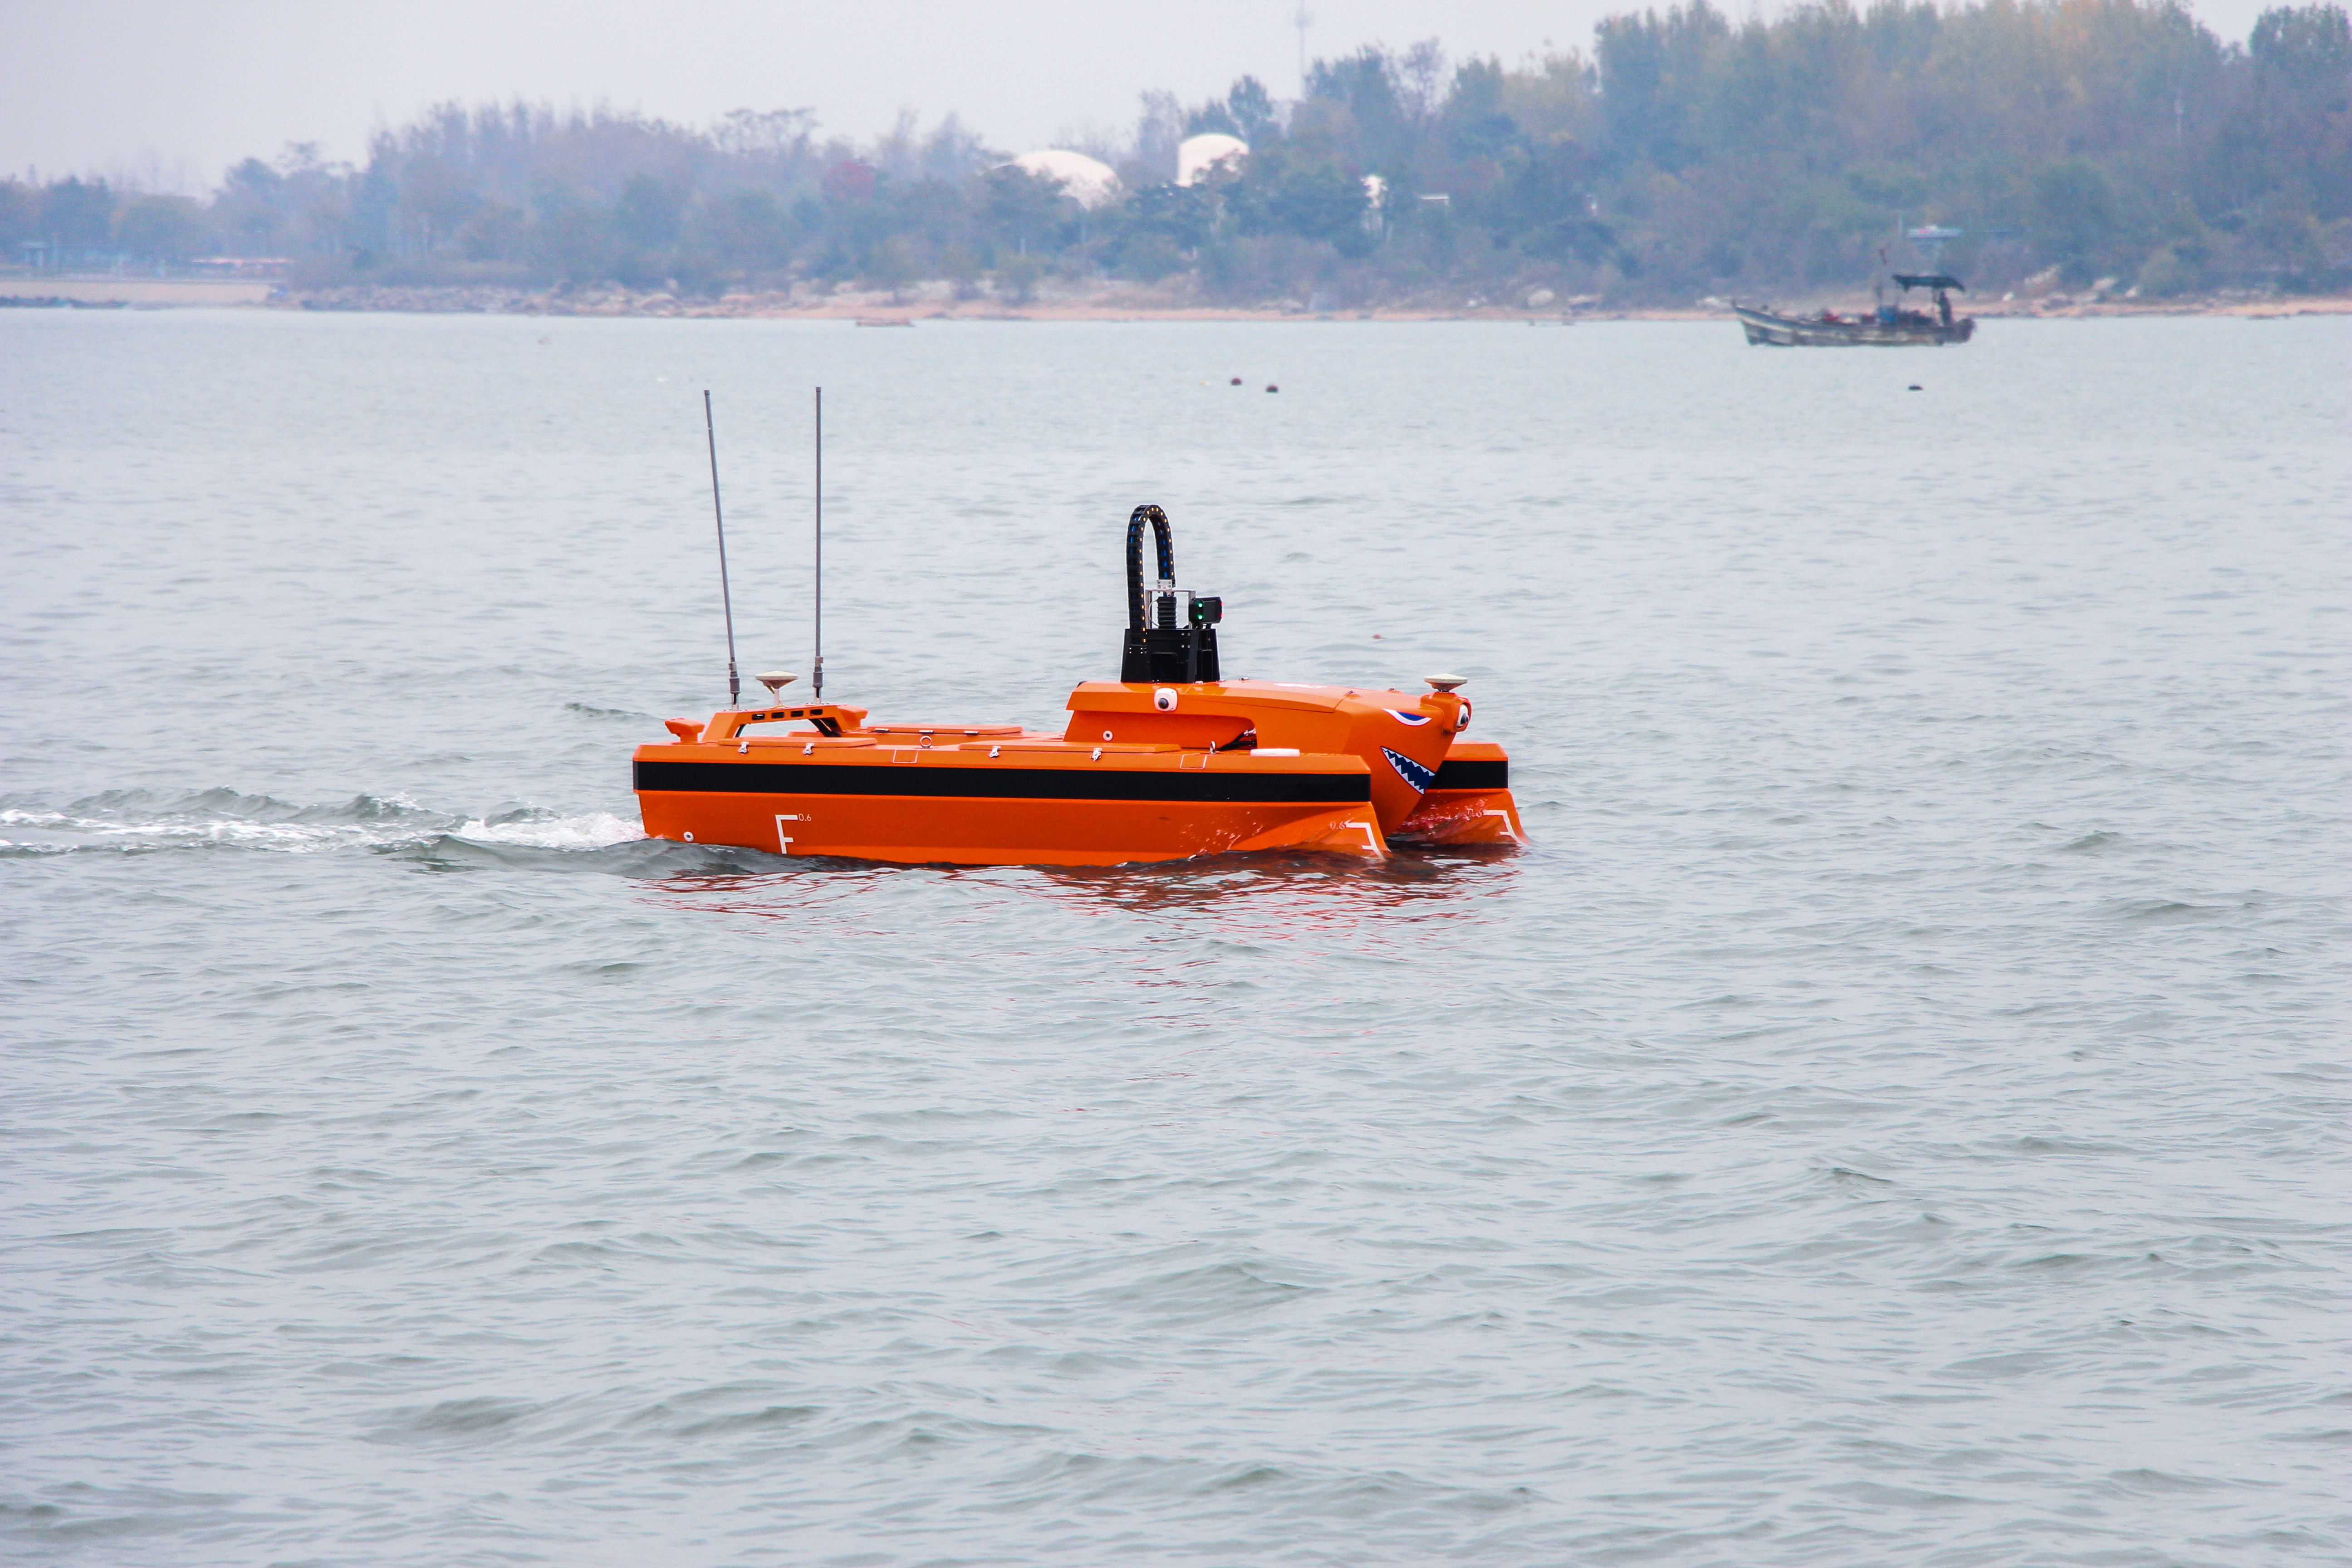
(a)M40 working in survey area
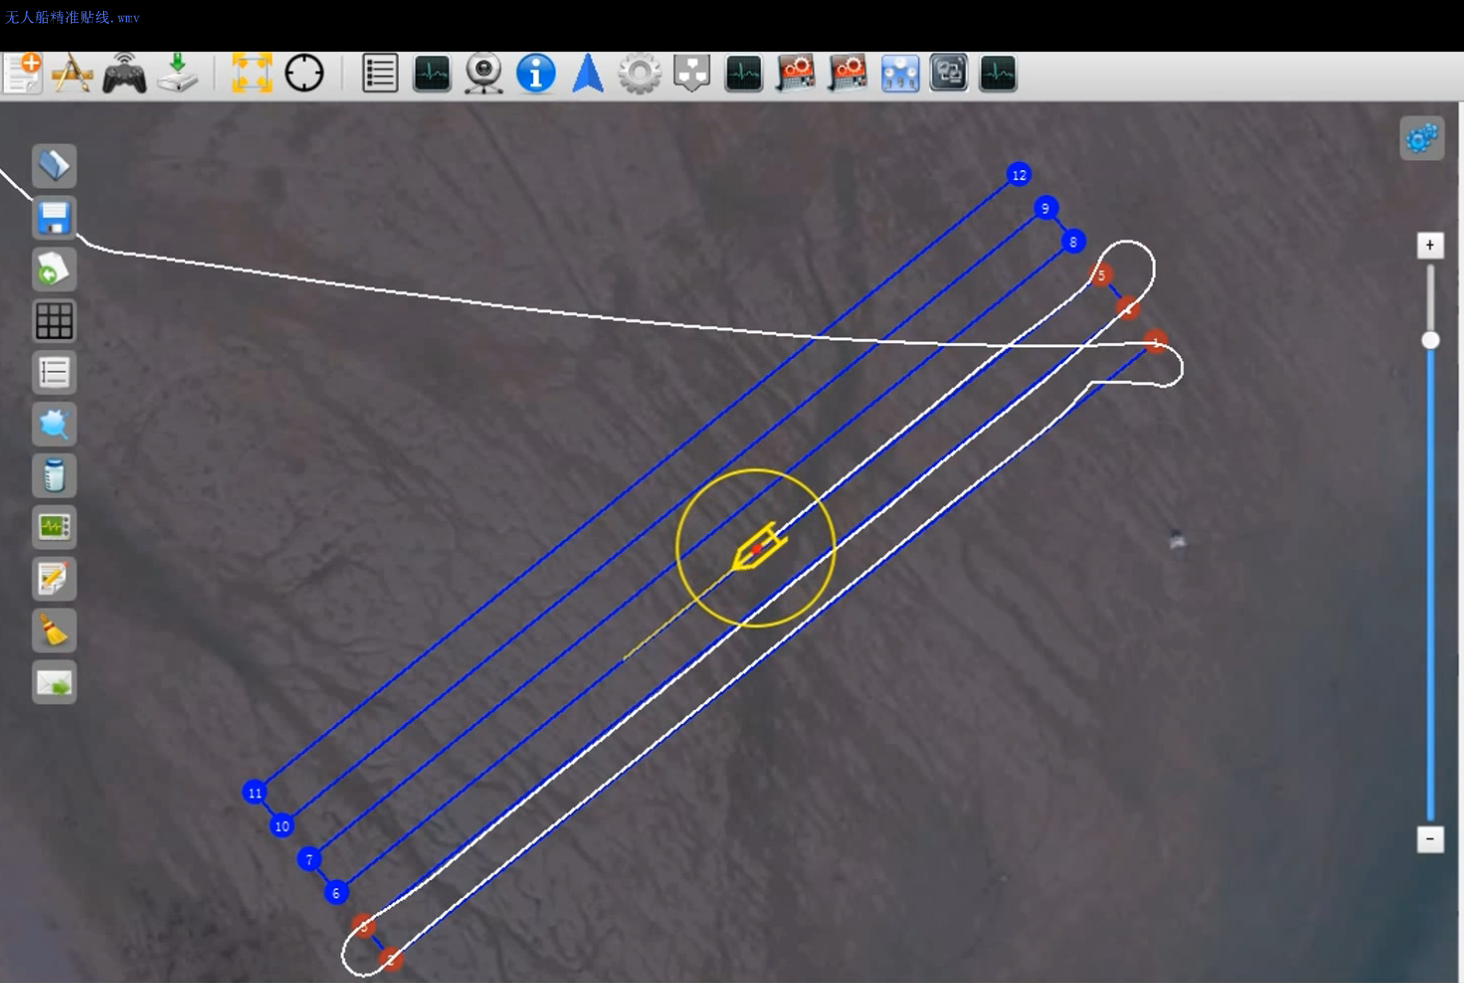
(b)Software interface showing the working situation of USV
Pic 5 Field test working situation
Analysis of the survey data shows that the overall heading of the USV is well maintained, multi-beam footprint is evenly distributed. There’s little lost to edge beams, the noise is minimal, the acoustic equipment is barely affected by noises. The survey data is in excellent quality, reaching the IH044 premium level standard.
Related Applications
We’d love to hear from you
Whether you have a question about features, trials, pricing, need a demo, or anything else, our team is ready to answer all your questions.